Interactive Graphic Ephemeris
The Graphic Ephemeris follows similar principles to the Time Lords Graph with the ability to generate charts on the fly just by clicking on the Graph which is date / degree encoded. The mouse cursor turns into a crosshair when hovering over the graph and will show the degree and date in a transparent hint to the bottom right of the crosshair that depends upon the position of your mouse.
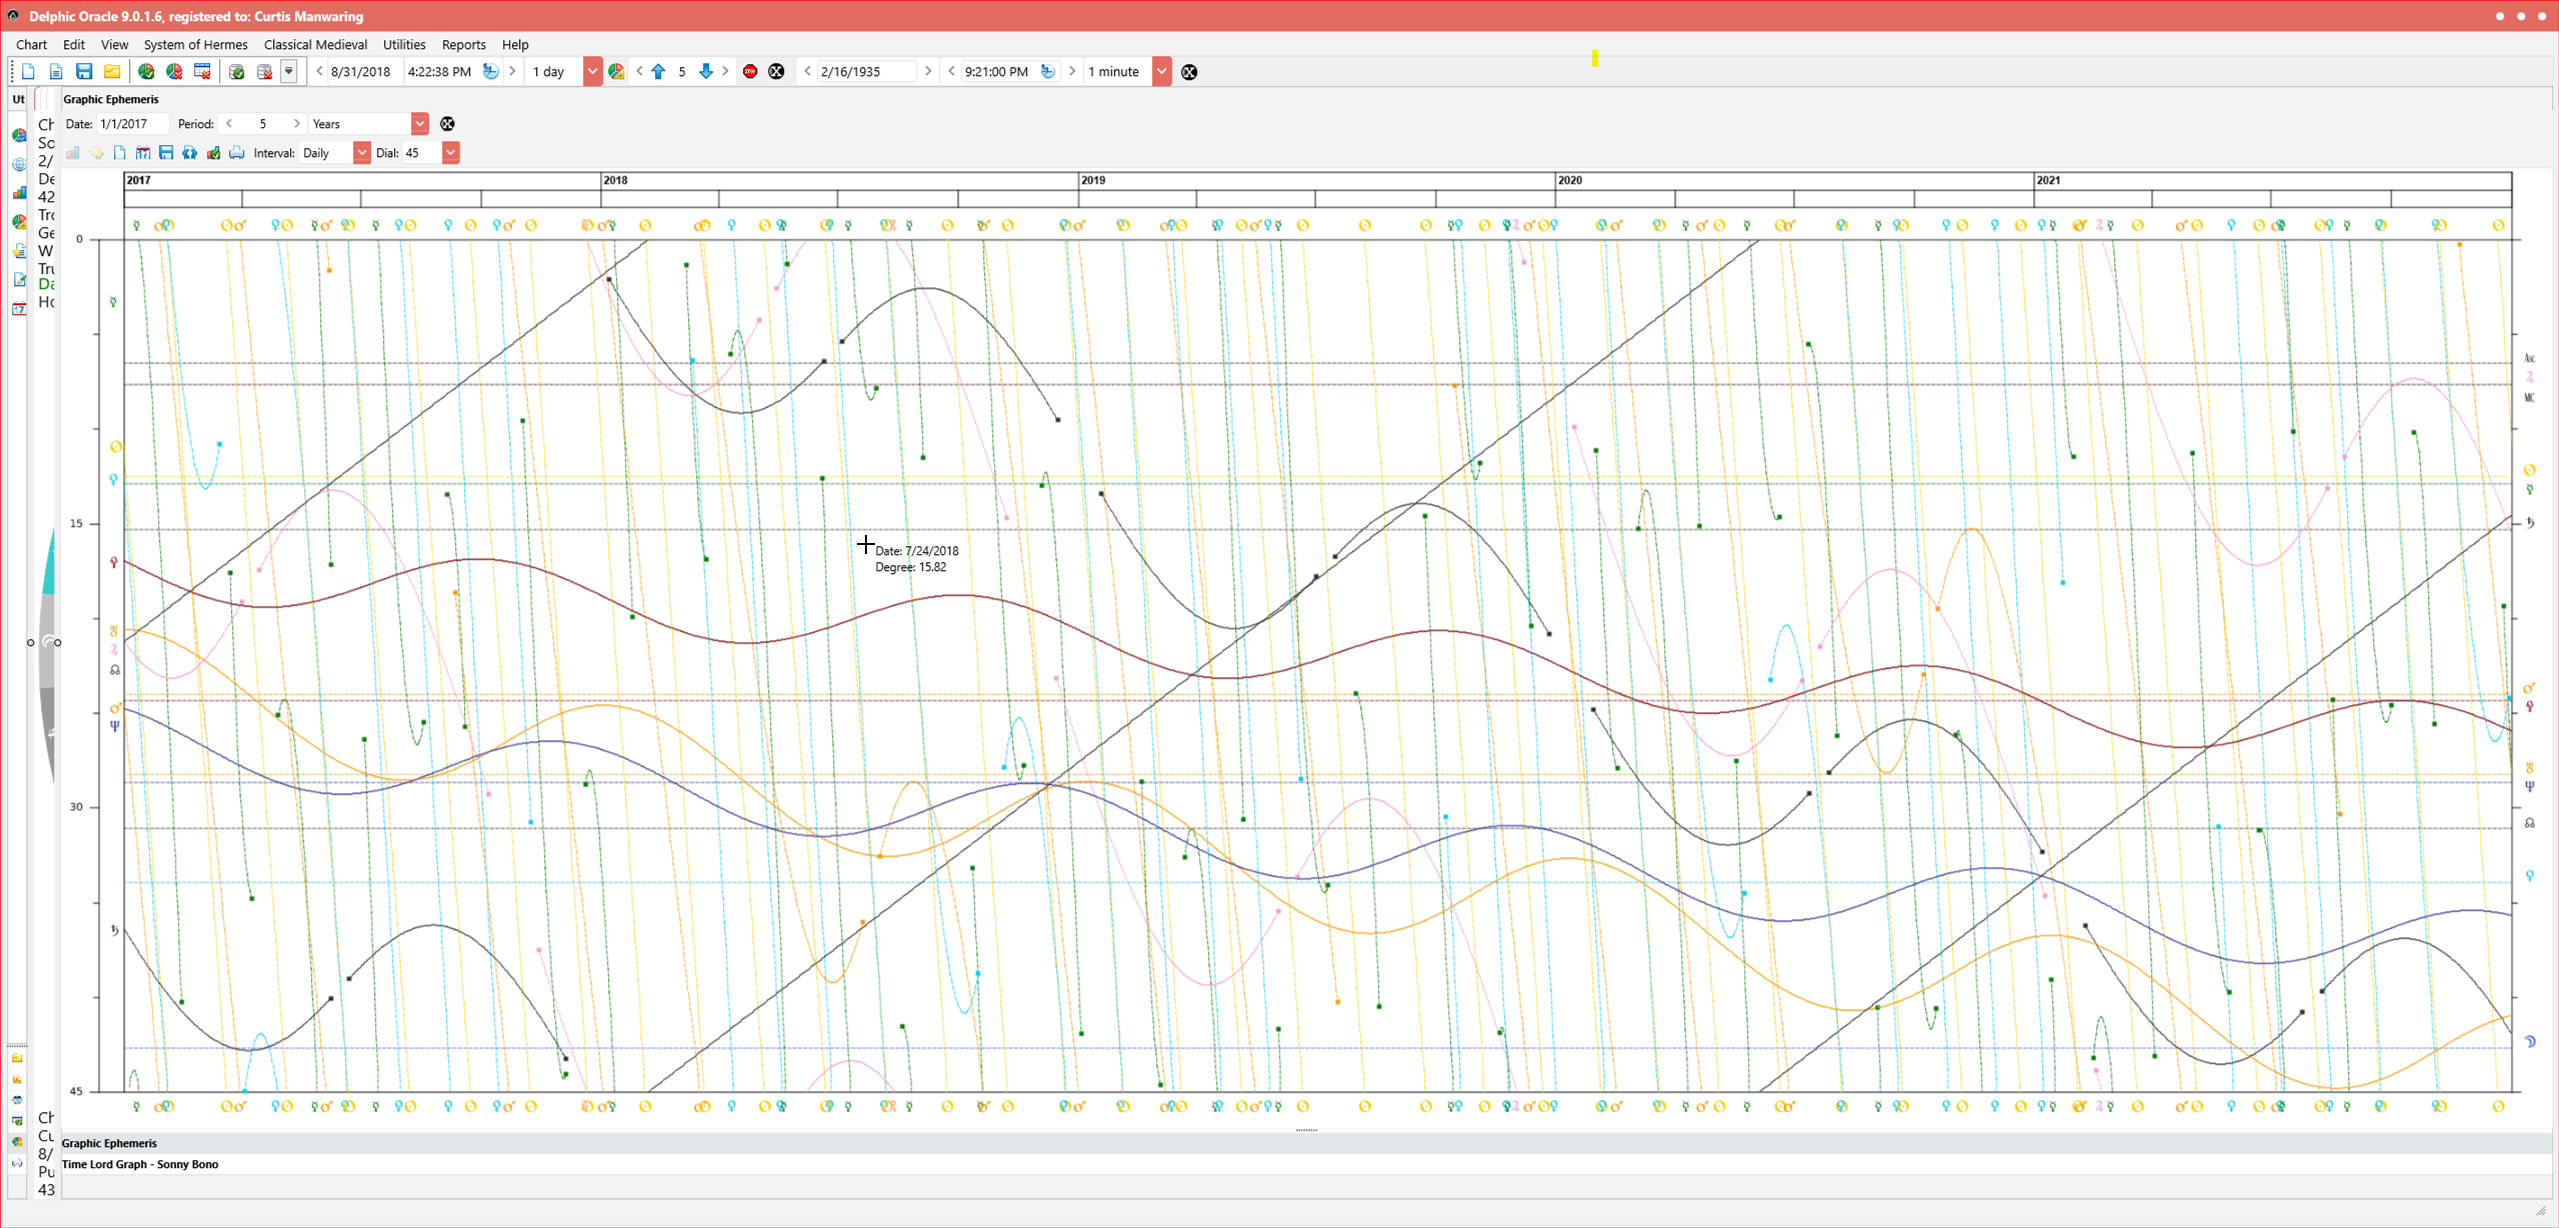
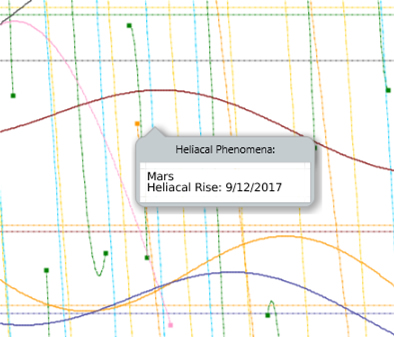
The other unique feature that shows on the graph is heliacal phenomena which is shown as dots on screen. These will bring up their own specific hints as to the phenomenon and can be turned off if you don't want to show heliacal phenomena. Natal planets show as horizontal lines whereas the transits have their characteristic curved lines flowing down when direct and up when retrograde. The faster planets have steeper curves downward whereas the outer planets show as wavy lines closer to the horizontal. These lines are color coded to the planet color in your Chart Designer Colors tab settings, using the same settings to match the overall environment set up by your GUI Styles and Chart Color Themes.
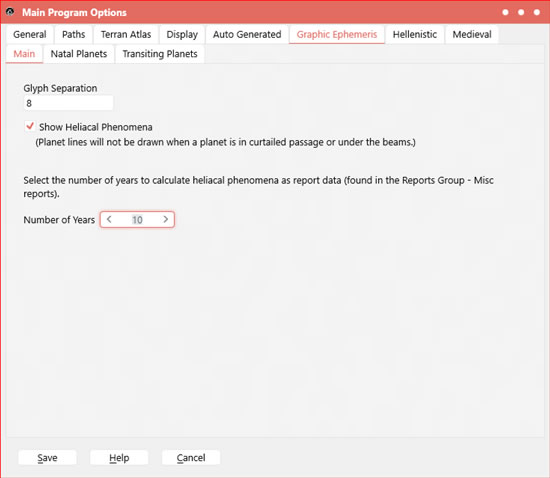
The options for the Graphic Ephemeris are a sub tab of the Main Options that can be reached by clicking on the Graph Options button in the Graphic Ephemeris window and shows the following options...
The Graphic Ephemeris also has a quick button to show phasis conditions within 7 days before and after birth which is important in Hellenistic astrology and shows phenomena including the Moon by default.
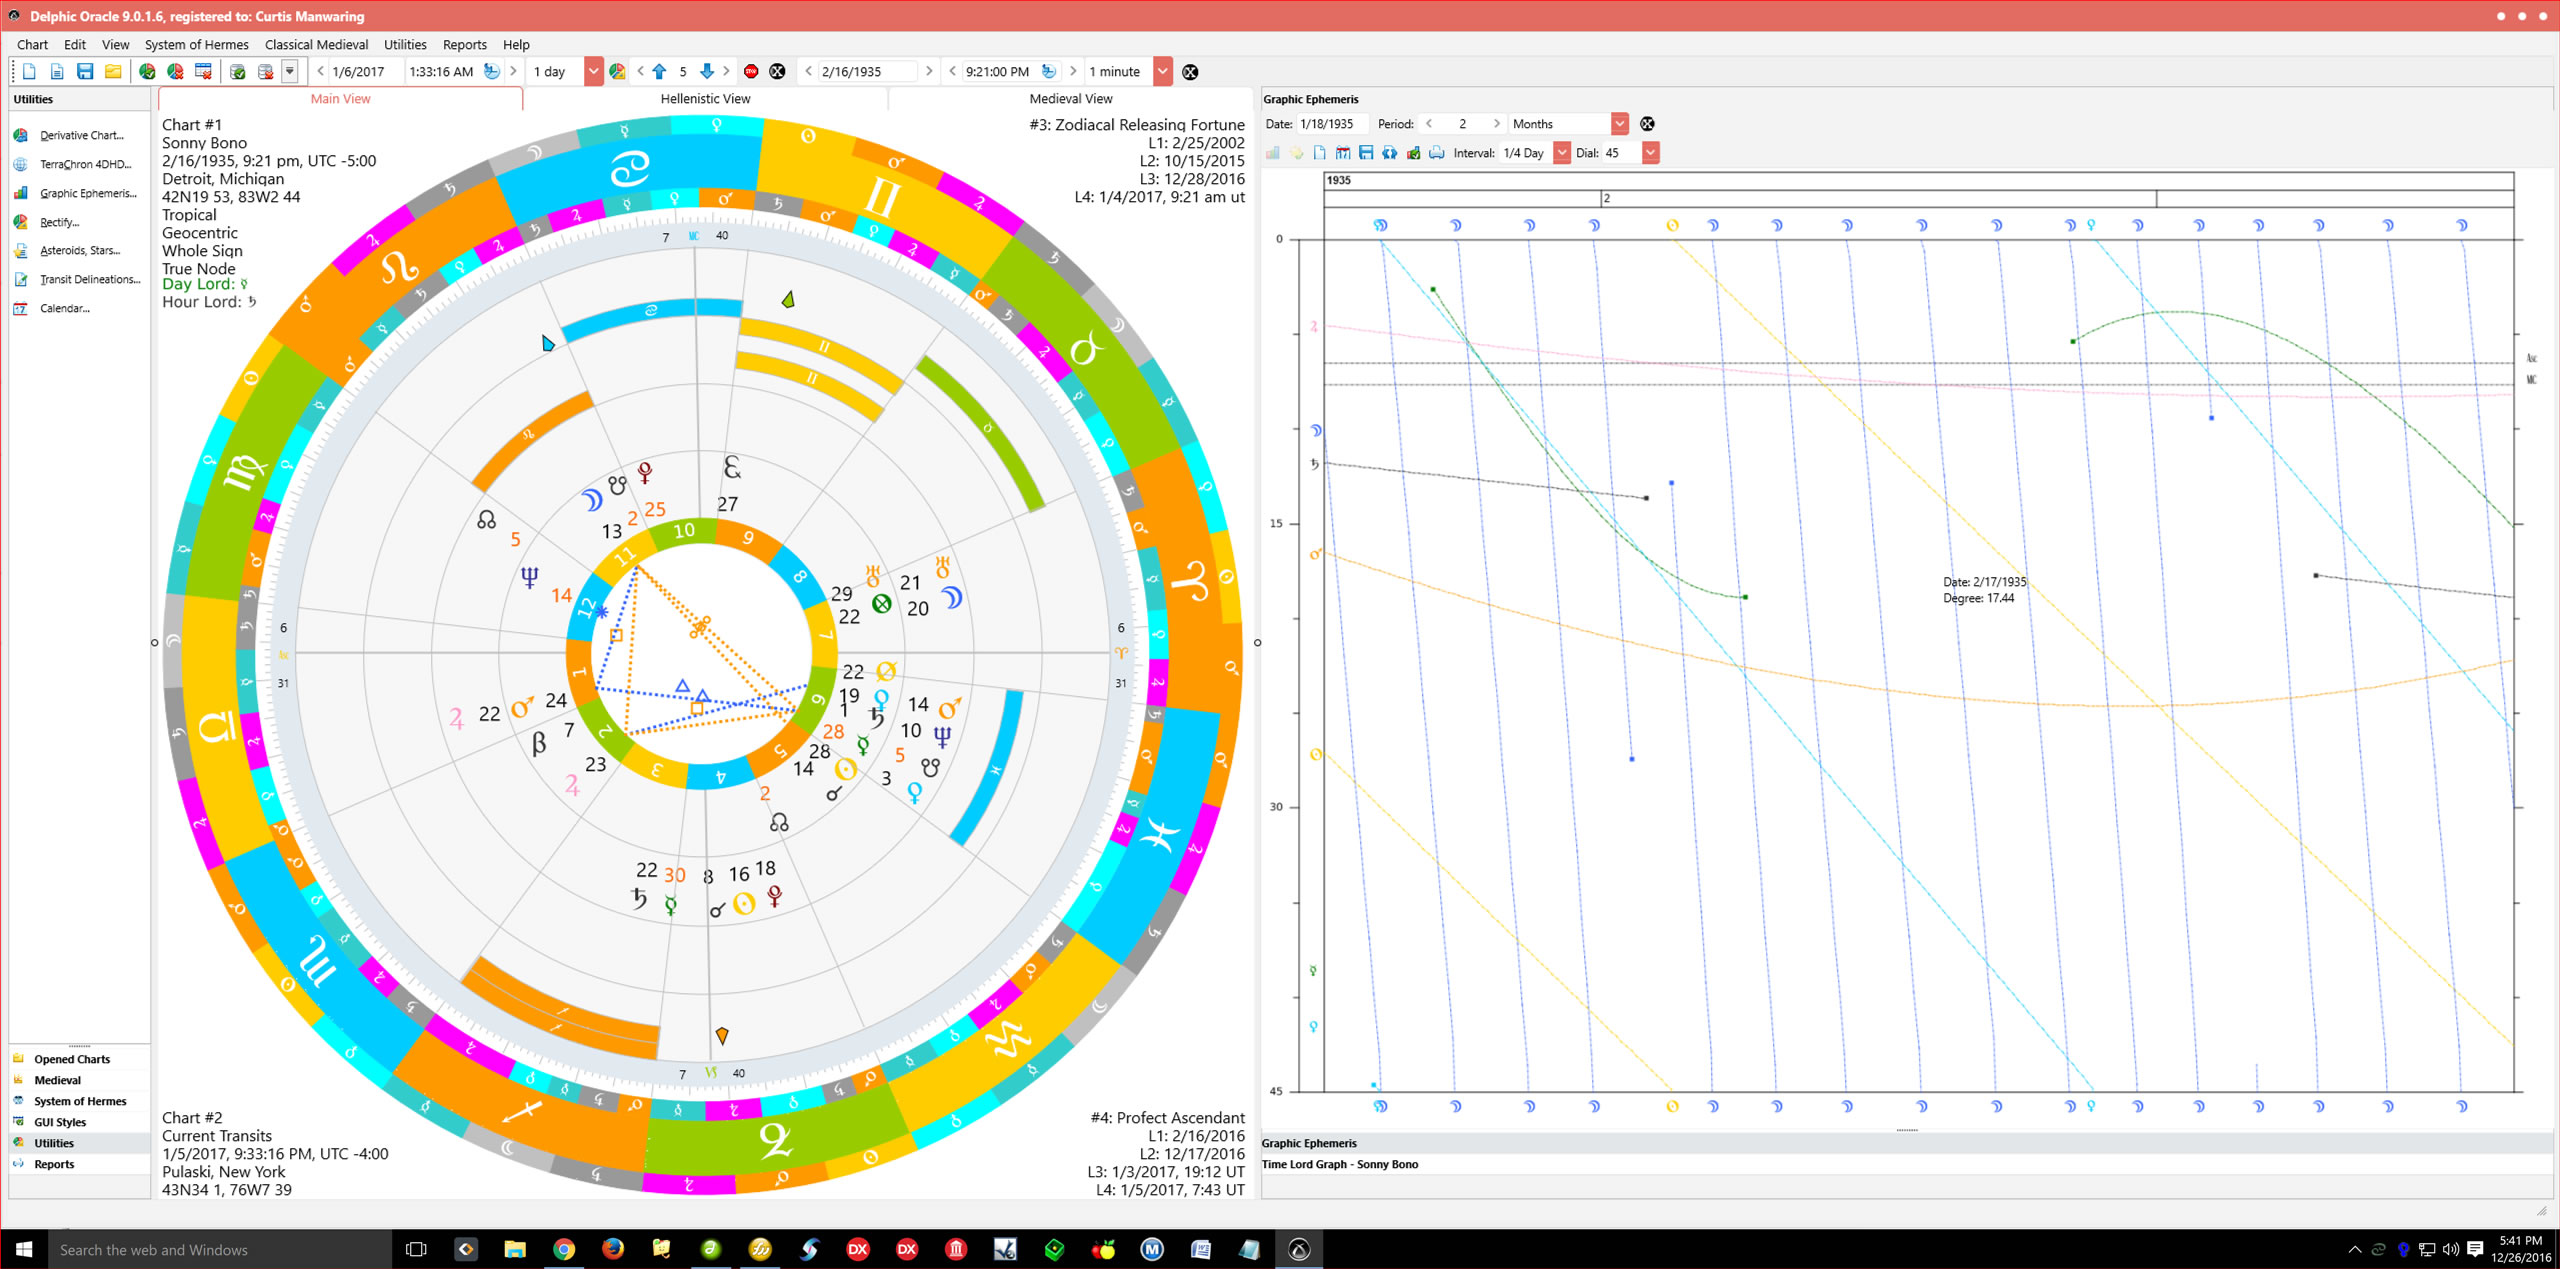
In the context of Hellenistic astrology, the most important consideration is finding what Vettius Valens calls "intensifications and relaxations" which is what the transits represent. Seeing these is very easy in the Graphic Ephemeris because blank areas show inactivity, whereas areas where several lines cross in the same area show intensification of effects. When combining this with the Time Lords graph, one can then find the periods that are most active or tense.